
According to the decision of the Ministry of Labor and Social Security1, minimum wages have been increased by 30% for the year 2025, as detailed below.
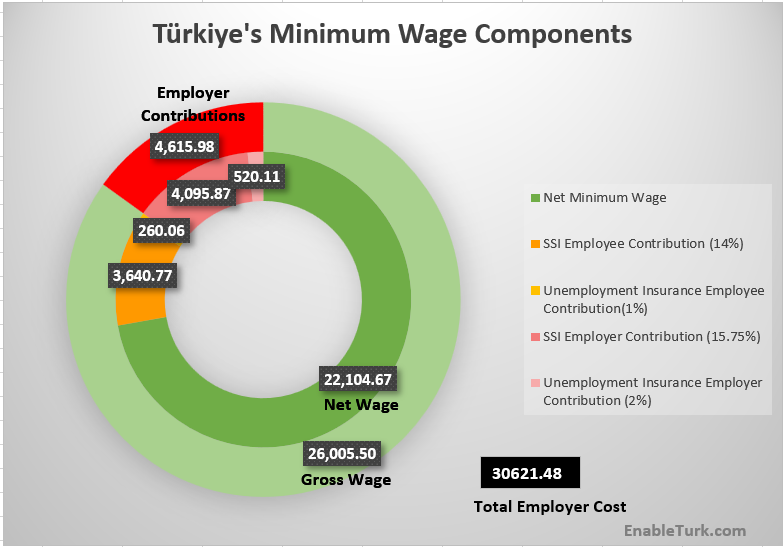
| Employer Cost | 30,556.44 TRY |
| Gross Minimum Wage | 26,005.50 TRY |
| Net Minimum Wage | 22,104.67 TRY |
At the beginning of the year, based on the USD/TRY exchange rate, the total employer cost for a minimum-wage employee was approximately 860 USD. The chart below illustrates that the minimum wage has increased in dollar terms since the second half of 2023 due to controlled exchange rates, which are expected to normalize in the near future.
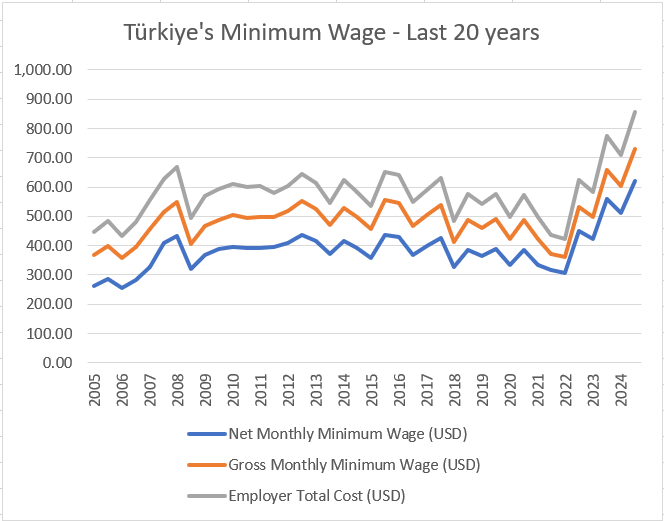
Statistics for the Past 20 Years2
| Year | H1/H2 | Net Monthly Minimum Wage (TRY) | Gross Monthly Minimum Wage (TRY) | Employer Total Cost (TRY) | USD/TRY Parity | Net Monthly Minimum Wage (USD) | Gross Monthly Minimum Wage (USD) | Employer Total Cost (USD) |
|---|---|---|---|---|---|---|---|---|
| 2025 | H1 | 22,104.00 | 26,005.50 | 30,621.48 | 35.78 | 617.78 | 726.82 | 855.83 |
| 2024 | H2 | 17,002.00 | 20,002.00 | 23,502.94 | 33.19 | 512.26 | 602.65 | 708.13 |
| 2024 | H1 | 17,002.00 | 20,002.00 | 23,502.94 | 30.39 | 559.46 | 658.18 | 773.38 |
| 2023 | H2 | 11,402.32 | 13,414.50 | 15,762.04 | 27.02 | 422.00 | 496.47 | 583.35 |
| 2023 | H1 | 8,506.80 | 10,008.00 | 11,759.40 | 18.84 | 451.53 | 531.21 | 624.17 |
| 2022 | H2 | 5,500.35 | 6,471.00 | 7,603.43 | 17.95 | 306.43 | 360.50 | 423.59 |
| 2022 | H1 | 4,253.40 | 5,004.00 | 5,879.70 | 13.45 | 316.24 | 372.04 | 437.15 |
| 2021 | H2 | 2,825.90 | 3,577.50 | 4,203.56 | 8.44 | 334.82 | 423.87 | 498.05 |
| 2021 | H1 | 2,825.90 | 3,577.50 | 4,203.56 | 7.35 | 384.48 | 486.73 | 571.91 |
| 2020 | H2 | 2,324.71 | 2,943.00 | 3,458.03 | 6.96 | 334.01 | 422.84 | 496.84 |
| 2020 | H1 | 2,324.71 | 2,943.00 | 3,458.03 | 5.99 | 388.10 | 491.32 | 577.30 |
| 2019 | H2 | 2,020.90 | 2,558.40 | 3,006.12 | 5.54 | 364.78 | 461.81 | 542.62 |
| 2019 | H1 | 2,020.90 | 2,558.40 | 3,006.12 | 5.23 | 386.41 | 489.18 | 574.78 |
| 2018 | H2 | 1,603.12 | 2,029.50 | 2,384.66 | 4.92 | 325.84 | 412.50 | 484.69 |
| 2018 | H1 | 1,603.12 | 2,029.50 | 2,384.66 | 3.77 | 425.23 | 538.33 | 632.54 |
| 2017 | H2 | 1,404.06 | 1,777.50 | 2,088.56 | 3.53 | 397.75 | 503.54 | 591.66 |
| 2017 | H1 | 1,404.06 | 1,777.50 | 2,088.56 | 3.80 | 369.49 | 467.76 | 549.62 |
| 2016 | H2 | 1,300.99 | 1,647.00 | 1,935.23 | 3.02 | 430.79 | 545.36 | 640.80 |
| 2016 | H1 | 1,300.99 | 1,647.00 | 1,935.23 | 2.97 | 438.04 | 554.55 | 651.59 |
| 2015 | H2 | 1,000.54 | 1,273.50 | 1,496.36 | 2.79 | 358.62 | 456.45 | 536.33 |
| 2015 | H1 | 949.07 | 1,201.50 | 1,411.76 | 2.42 | 392.18 | 496.49 | 583.37 |
| 2014 | H2 | 891.03 | 1,134.00 | 1,332.45 | 2.14 | 416.37 | 529.91 | 622.64 |
| 2014 | H1 | 846.00 | 1,071.00 | 1,247.72 | 2.28 | 371.05 | 469.74 | 547.25 |
| 2013 | H2 | 803.68 | 1,021.50 | 1,190.05 | 1.94 | 414.27 | 526.55 | 613.43 |
| 2013 | H1 | 773.01 | 978.60 | 1,140.07 | 1.77 | 436.73 | 552.88 | 644.11 |
| 2012 | H2 | 739.79 | 940.50 | 1,095.68 | 1.81 | 408.72 | 519.61 | 605.35 |
| 2012 | H1 | 701.13 | 886.50 | 1,032.77 | 1.78 | 393.89 | 498.03 | 580.21 |
| 2011 | H2 | 658.95 | 837.00 | 1,016.95 | 1.68 | 392.23 | 498.21 | 605.33 |
| 2011 | H1 | 629.96 | 796.50 | 967.75 | 1.61 | 391.28 | 494.72 | 601.09 |
| 2010 | H2 | 599.12 | 760.50 | 924.01 | 1.51 | 396.77 | 503.64 | 611.93 |
| 2010 | H1 | 576.57 | 729.00 | 885.74 | 1.49 | 386.96 | 489.26 | 594.46 |
| 2009 | H2 | 546.48 | 693.00 | 841.99 | 1.48 | 369.24 | 468.24 | 568.91 |
| 2009 | H1 | 527.13 | 666.00 | 809.19 | 1.64 | 321.42 | 406.10 | 493.41 |
| 2008 | H2 | 503.26 | 638.70 | 776.02 | 1.16 | 433.84 | 550.60 | 668.98 |
| 2008 | H1 | 481.55 | 608.40 | 739.21 | 1.18 | 408.09 | 515.59 | 626.45 |
| 2007 | H2 | 419.15 | 585.00 | 710.78 | 1.28 | 327.46 | 457.03 | 555.30 |
| 2007 | H1 | 403.03 | 562.50 | 683.44 | 1.42 | 283.82 | 396.13 | 481.30 |
| 2006 | H2 | 380.46 | 531.00 | 645.17 | 1.49 | 255.34 | 356.38 | 433.00 |
| 2006 | H1 | 380.46 | 531.00 | 645.17 | 1.33 | 286.06 | 399.25 | 485.09 |
| 2005 | H2 | 350.15 | 488.70 | 593.77 | 1.33 | 263.27 | 367.44 | 446.44 |
| 2005 | H1 | 350.15 | 488.70 | 593.77 | 1.34 | 261.31 | 364.70 | 443.11 |
For H1, the USD/TRY rate is based on the January closing value (the month when payments occur), and for H2, it uses the July closing value.3
Feel free to reach out to us with any inquiries about the Turkish business environment.
- The announcement news dated 24.12.2024 from CSGB ↩︎
- Ministry of family and social services MinimumWage by years ↩︎
- CBRT Exchange Rates ↩︎